ELK是elasticsearch、logstash、kibana、filebeat等一套软件的集合,通过这套软件可以在企业服务器搭建日志搜集系统。
下载elasticsearch、logstash、kibana三个软件安装包
1
2
3
4
5
6
7
8
9
10
11
1. wget https://artifacts.elastic.co/downloads/elasticsearch/elasticsearch-6.5.3.tar.gz 2. wget https://artifacts.elastic.co/downloads/kibana/kibana-6.5.3-linux-x86_64.tar.gz 3. wget https://artifacts.elastic.co/downloads/logstash/logstash-6.5.3.tar.gz 4.
解压安装包
1 tar -zxvf elasticsearch-6.5.3.tar.gz -C /usr/local/bin
配置master主机上的elasticsearch,vim /etc/elasticsearch/elasticsearch.yml
1
2
3
4
5
6
7
8
9
10
11
12
13
14
15
16
17
18
19
20
21
22
1. cluster.name: es-cluster # 集群中的名称 2. node.name: master-node # 该节点名称 3. node.master: true # 意思是该节点为主节点 4. node.data: false # 表示这不是数据节点 5. network.host: 192.168.134.129 6. http.port: 9200 # es服务的端口号 7. discovery.zen.ping.unicast.hosts: ["192.168.134.129", "192.168.134.130"]
配置slave主机上的elasticsearch,vim /etc/elasticsearch/elasticsearch.yml
1
2
3
4
5
6
7
8
9
10
11
12
13
14
15
16
17
18
19
20
21
22
1. cluster.name: es-cluster 2. node.name: data-node1 3. node.master: false 4. node.data: true 5. network.host: 192.168.134.130 6. http.port: 9200 7. discovery.zen.ping.unicast.hosts: ["192.168.134.129", "192.168.134.130"]
先启动主节点上,再依次启动其他节点
elasticsearch可能出现的错误 :
【ERROR】max file descriptors [4096] for elasticsearch process is too low, increase to at least [65536]
编辑系统配置文件,vim /etc/security/limits.conf
添加
1
2
3
4
5
6
7
8
9
10
11
12
13
1. * soft nofile 65536 2. * hard nofile 131072 3. * soft nproc 2048 4. * hard nproc 4096
vim /etc/security/limits.d/20-nproc.conf,添加
1
2
3
4
5
6
7
1. * soft nproc 4096 2. root soft nproc unlimited
vim /etc/sysctl.conf,添加
加载配置,sysctl -p
查看es集群情况,curl ‘192.168.134.129:9200/_cluster/health?pretty’
status为green则代表健康没问题,如果是yellow或者red则是集群有问题。
查看集群的详细信息:curl ‘192.168.134.129:9200/_cluster/state?pretty’
添加kibana配置文件
1
2
3
4
5
6
7
8
9
10
11
12
13
1. server.port: 5601 # 配置kibana的端口 2. server.host: 192.168.77.128 # 配置监听ip 3. elasticsearch.url: "http://192.168.77.128:9200" 4. logging.dest: /var/log/kibana.log
创建日志文件:
1 [root@master-node ~]# touch /var/log/kibana.log; chmod 777 /var/log/kibana.log
启动kibana服务,并检查进程和监听端口:
1
2
3
4
5
6
7
8
9
10
11
12
13
14
15
16
17
18
19
20
21
22
1. [root@master-node ~]# systemctl start kibana 2. [root@master-node ~]# ps aux |grep kibana 3. kibana 3083 36.8 2.9 1118668 112352 ? Ssl 17:14 0:03 /usr/share/kibana/bin/../node/bin/node --no-warnings /usr/share/kibana/bin/../src/cli -c /etc/kibana/kibana.yml 4. root 3095 0.0 0.0 112660 964 pts/0 S+ 17:14 0:00 grep --color=auto kibana 5. [root@master-node ~]# netstat -lntp |grep 5601 6. tcp 0 0 192.168.77.128:5601 0.0.0.0:* LISTEN 3083/node 7. [root@master-node ~]#
注:由于kibana是使用node.js开发的,所以进程名称为node
然后在浏览器里进行访问,如:http://192.168.77.128:5601/ ,由于我们并没有安装x-pack,所以此时是没有用户名和密码的,可以直接访问的:
到此我们的kibana就安装完成了,很简单,接下来就是安装logstash,不然kibana是没法用的。
在192.168.77.130上安装logstash,但是要注意的是目前logstash不支持JDK1.9。
直接yum安装,安装命令如下:
1 [root@data-node1 ~]# yum install -y logstash
如果yum源的速度太慢的话就下载rpm包来进行安装:
1
2
3
4
5
6
7
1. [root@data-node1 ~]# wget https://artifacts.elastic.co/downloads/logstash/logstash-6.0.0.rpm 2. [root@data-node1 ~]# rpm -ivh logstash-6.0.0.rpm
安装完之后,先不要启动服务,先配置logstash收集syslog日志:
1
2
3
4
5
6
7
8
9
10
11
12
13
14
15
16
17
18
19
20
21
22
23
24
25
26
27
28
29
30
31
32
33
34
35
36
37
1. [root@data-node1 ~]# vim /etc/logstash/conf.d/syslog.conf # 加入如下内容 2. input { # 定义日志源 3. syslog { 4. type => "system-syslog" # 定义类型 5. port => 10514 # 定义监听端口 6. } 7. } 8. output { # 定义日志输出 9. stdout { 10. codec => rubydebug # 将日志输出到当前的终端上显示 11. } 12. }
检测配置文件是否有错:
1
2
3
4
5
6
7
8
9
10
11
12
13
14
15
16
1. [root@data-node1 ~]# cd /usr/share/logstash/bin 2. [root@data-node1 /usr/share/logstash/bin]# ./logstash --path.settings /etc/logstash/ -f /etc/logstash/conf.d/syslog.conf --config.test_and_exit 3. Sending Logstash's logs to /var/log/logstash which is now configured via log4j2.properties 4. Configuration OK # 为ok则代表配置文件没有问题 5. [root@data-node1 /usr/share/logstash/bin]#
命令说明:
–path.settings 用于指定logstash的配置文件所在的目录
-f 指定需要被检测的配置文件的路径
–config.test_and_exit 指定检测完之后就退出,不然就会直接启动了 配置kibana服务器的ip以及配置的监听端口:
1
2
3
4
5
6
7
8
9
10
11
1. [root@data-node1 ~]# vim /etc/rsyslog.conf 2. #### RULES #### 3. 4. *.* @@192.168.77.130:10514
重启rsyslog,让配置生效:
1 [root@data-node1 ~]# systemctl restart rsyslog
指定配置文件,启动logstash:
1
2
3
4
5
6
7
8
9
10
11
12
13
1. [root@data-node1 ~]# cd /usr/share/logstash/bin 2. [root@data-node1 /usr/share/logstash/bin]# ./logstash --path.settings /etc/logstash/ -f /etc/logstash/conf.d/syslog.conf 3. Sending Logstash's logs to /var/log/logstash which is now configured via log4j2.properties 4. # 这时终端会停留在这里,因为我们在配置文件中定义的是将信息输出到当前终端
打开新终端检查一下10514端口是否已被监听:
1
2
3
4
5
6
7
8
9
10
1. [root@data-node1 ~]# netstat -lntp |grep 10514 2. tcp6 0 0 :::10514 :::* LISTEN 4312/java 3. [root@data-node1 ~]#
然后在别的机器ssh登录到这台机器上,测试一下有没有日志输出:
如上,可以看到,终端中以JSON的格式打印了收集到的日志,测试成功。
以上只是测试的配置,这一步我们需要重新改一下配置文件,让收集的日志信息输出到es服务器中,而不是当前终端:
1
2
3
4
5
6
7
8
9
10
11
12
13
14
15
16
17
18
19
20
21
22
23
24
25
26
27
28
29
30
31
32
33
34
35
36
37
38
39
40
1. [root@data-node1 ~]# vim /etc/logstash/conf.d/syslog.conf # 更改为如下内容 2. input { 3. syslog { 4. type => "system-syslog" 5. port => 10514 6. } 7. } 8. output { 9. elasticsearch { 10. hosts => ["192.168.77.128:9200"] # 定义es服务器的ip 11. index => "system-syslog-%{+YYYY.MM}" # 定义索引 12. } 13. }
同样的需要检测配置文件有没有错:
1
2
3
4
5
6
7
8
9
10
11
12
13
14
15
16
1. [root@data-node1 ~]# cd /usr/share/logstash/bin 2. [root@data-node1 /usr/share/logstash/bin]# ./logstash --path.settings /etc/logstash/ -f /etc/logstash/conf.d/syslog.conf --config.test_and_exit 3. Sending Logstash's logs to /var/log/logstash which is now configured via log4j2.properties 4. Configuration OK 5. [root@data-node1 /usr/share/logstash/bin]#
没问题后,启动logstash服务,并检查进程以及监听端口:
1
2
3
4
5
6
7
8
9
10
11
12
13
1. [root@data-node1 ~]# systemctl start logstash 2. [root@data-node1 ~]# ps aux |grep logstash 3. logstash 5364 285 20.1 3757012 376260 ? SNsl 04:36 0:34 /bin/java -XX:+UseParNewGC -XX:+UseConcMarkSweepGC -XX:CMSInitiatingOccupancyFraction=75 -XX:+UseCMSInitiatingOccupancyOnly -XX:+DisableExplicitGC -Djava.awt.headless=true -Dfile.encoding=UTF-8 -XX:+HeapDumpOnOutOfMemoryError -Xmx1g -Xms256m -Xss2048k -Djffi.boot.library.path=/usr/share/logstash/vendor/jruby/lib/jni -Xbootclasspath/a:/usr/share/logstash/vendor/jruby/lib/jruby.jar -classpath : -Djruby.home=/usr/share/logstash/vendor/jruby -Djruby.lib=/usr/share/logstash/vendor/jruby/lib -Djruby.script=jruby -Djruby.shell=/bin/sh org.jruby.Main /usr/share/logstash/lib/bootstrap/environment.rb logstas/runner.rb --path.settings /etc/logstash 4. root 5400 0.0 0.0 112652 964 pts/0 S+ 04:36 0:00 grep --color=auto logstash
完成了logstash服务器的搭建之后,回到kibana服务器上查看日志,执行以下命令可以获取索引信息:
1
2
3
4
5
6
7
8
9
10
11
12
13
14
15
16
1. [root@master-node ~]# curl '192.168.77.128:9200/_cat/indices?v' 2. health status index uuid pri rep docs.count docs.deleted store.size pri.store.size 3. green open .kibana 6JfXc0gFSPOWq9gJI1ZX2g 1 1 1 0 6.9kb 3.4kb 4. green open system-syslog-2018.03 bUXmEDskTh6fjGD3JgyHcA 5 1 61 0 591.7kb 296.7kb 5. [root@master-node ~]#
如上,可以看到,在logstash配置文件中定义的system-syslog索引成功获取到了,证明配置没问题,logstash与es通信正常。
获取指定索引详细信息:
如果日后需要删除索引的话,使用以下命令可以删除指定索引:
1 curl -XDELETE 'localhost:9200/system-syslog-2018.03'
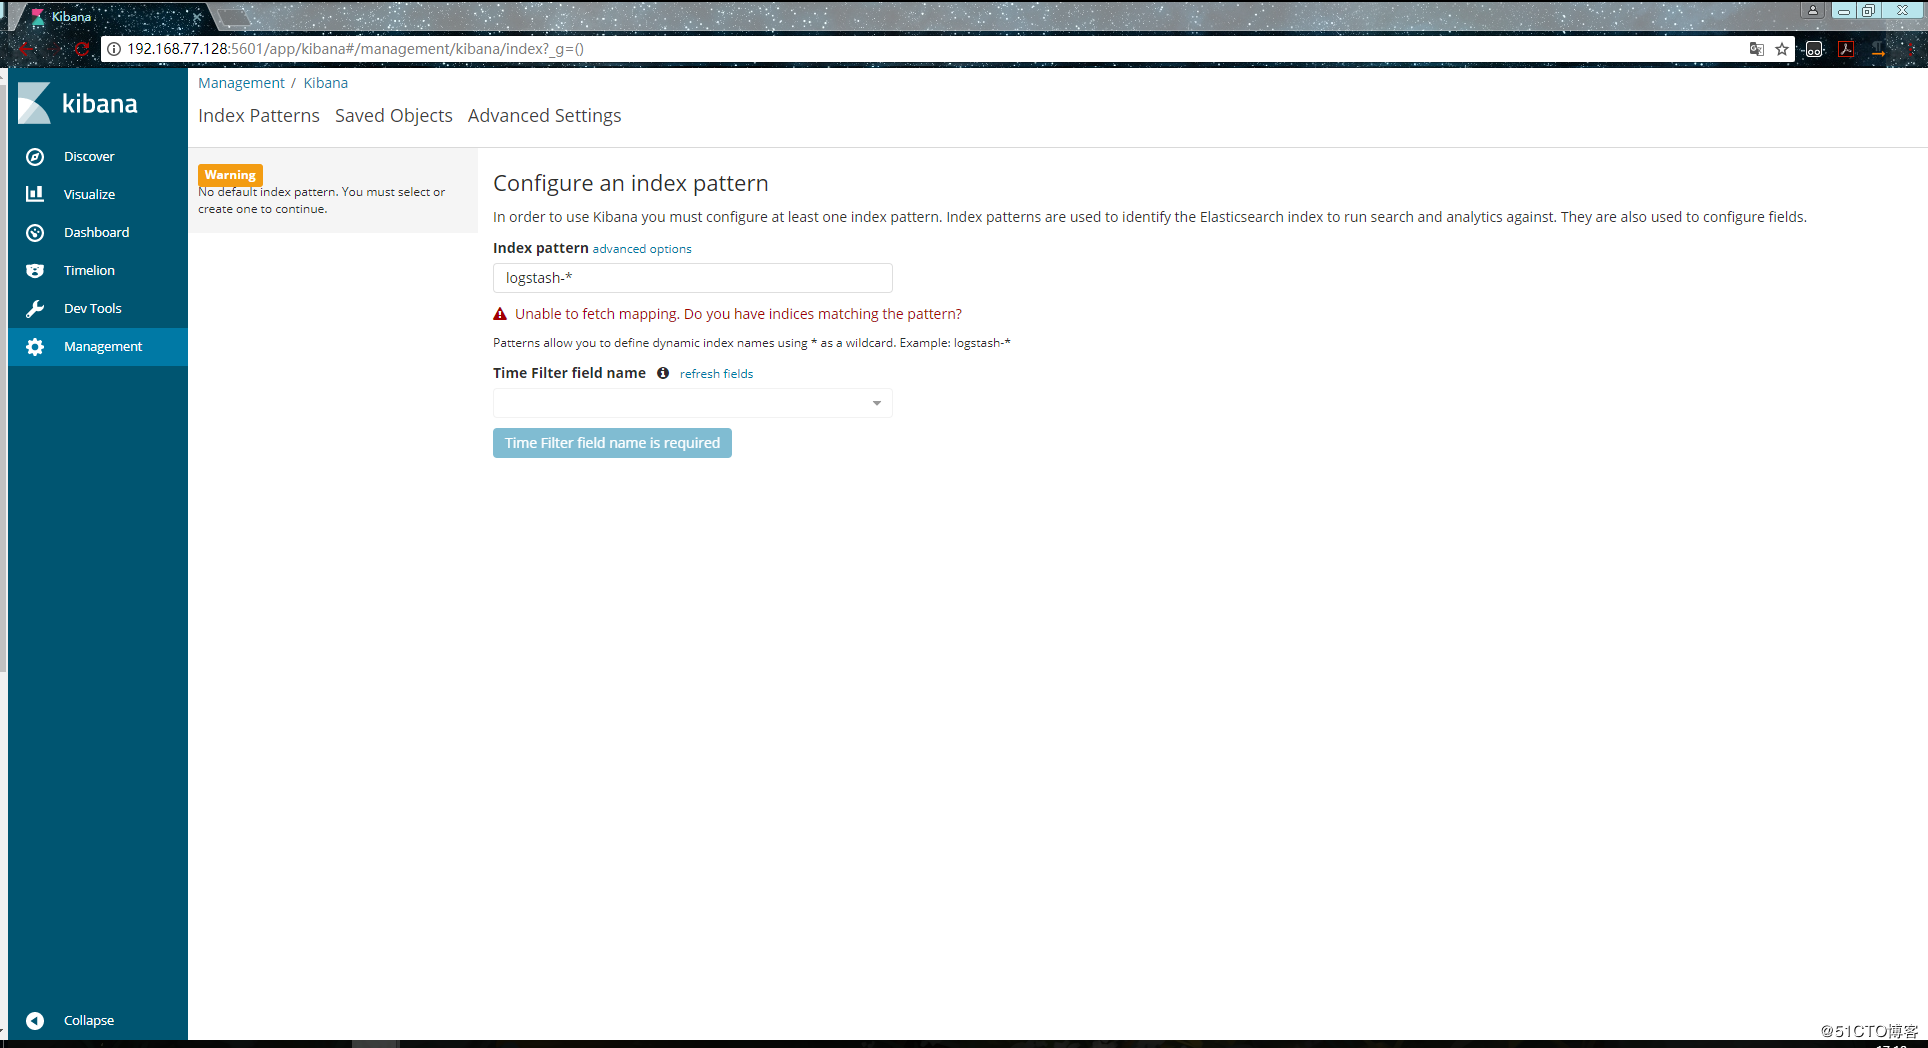
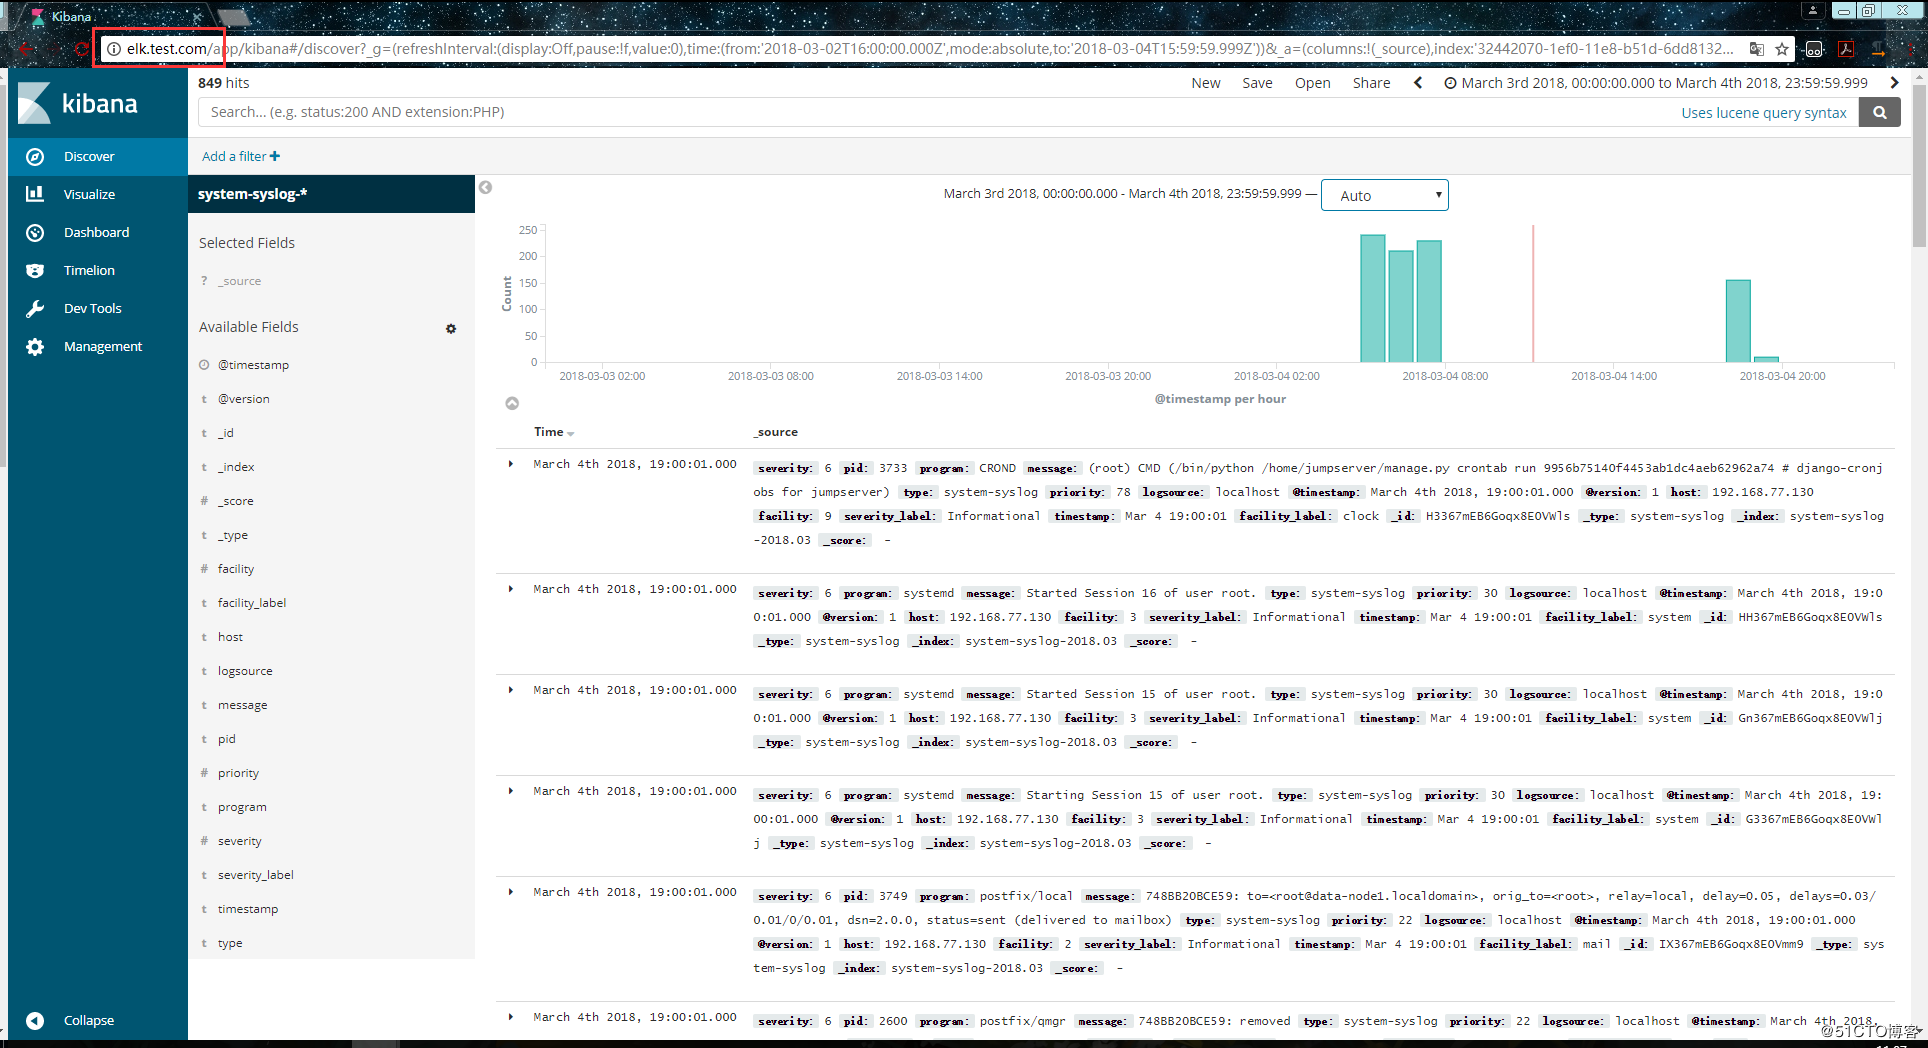
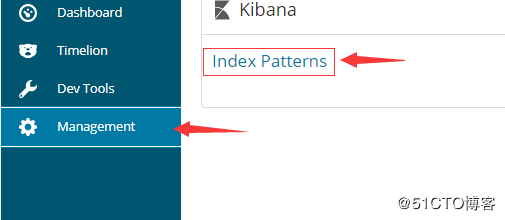
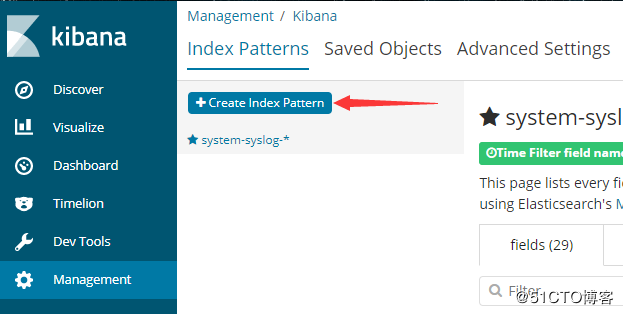
es与logstash能够正常通信后就可以去配置kibana了,浏览器访问192.168.77.128:5601,到kibana页面上配置索引:
我们也可以使用通配符,进行批量匹配:
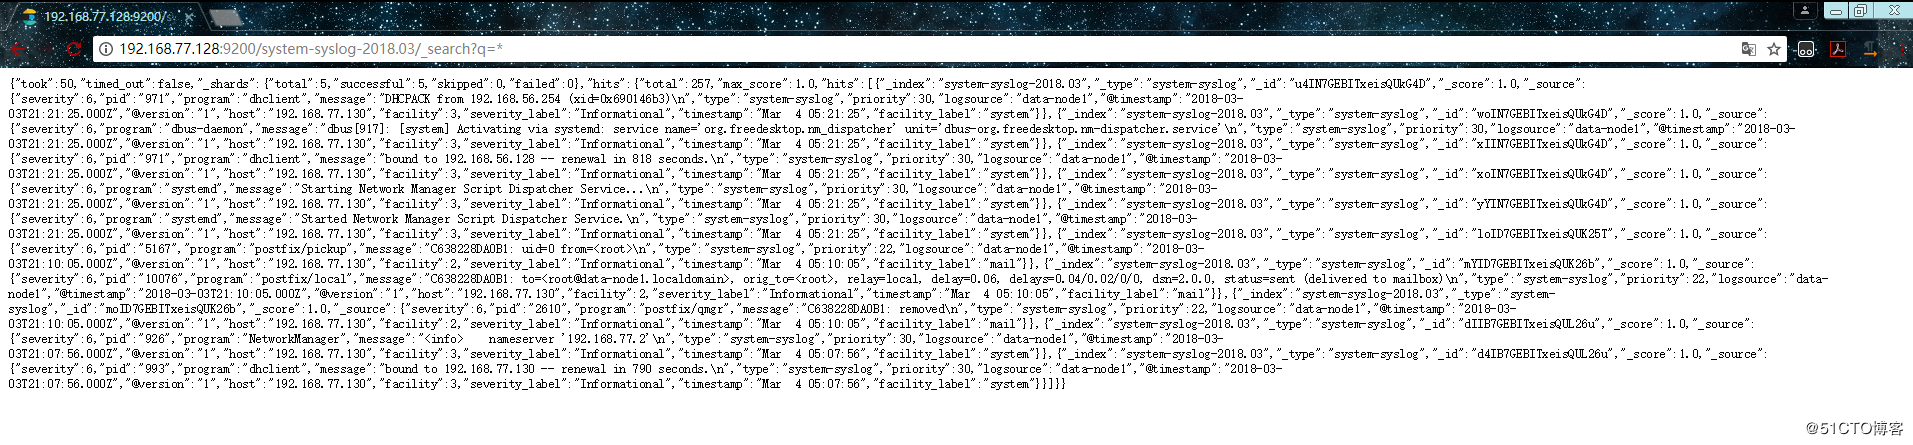
如果还是不行的话,就换几个时间试试,换了几个时间都不行的话,就在浏览器中直接访问es服务器看看是否有反馈出信息:
http://192.168.77.128:9200/system-syslog-2018.03/_search?q =*
如下,这是正常返回信息的情况,如果有问题的话是会返回error的:
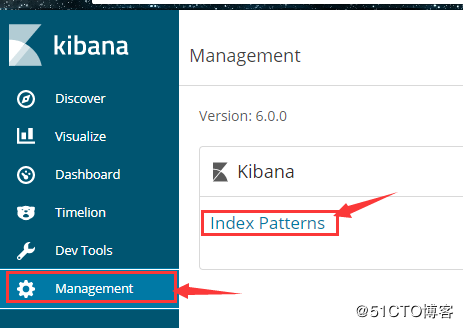
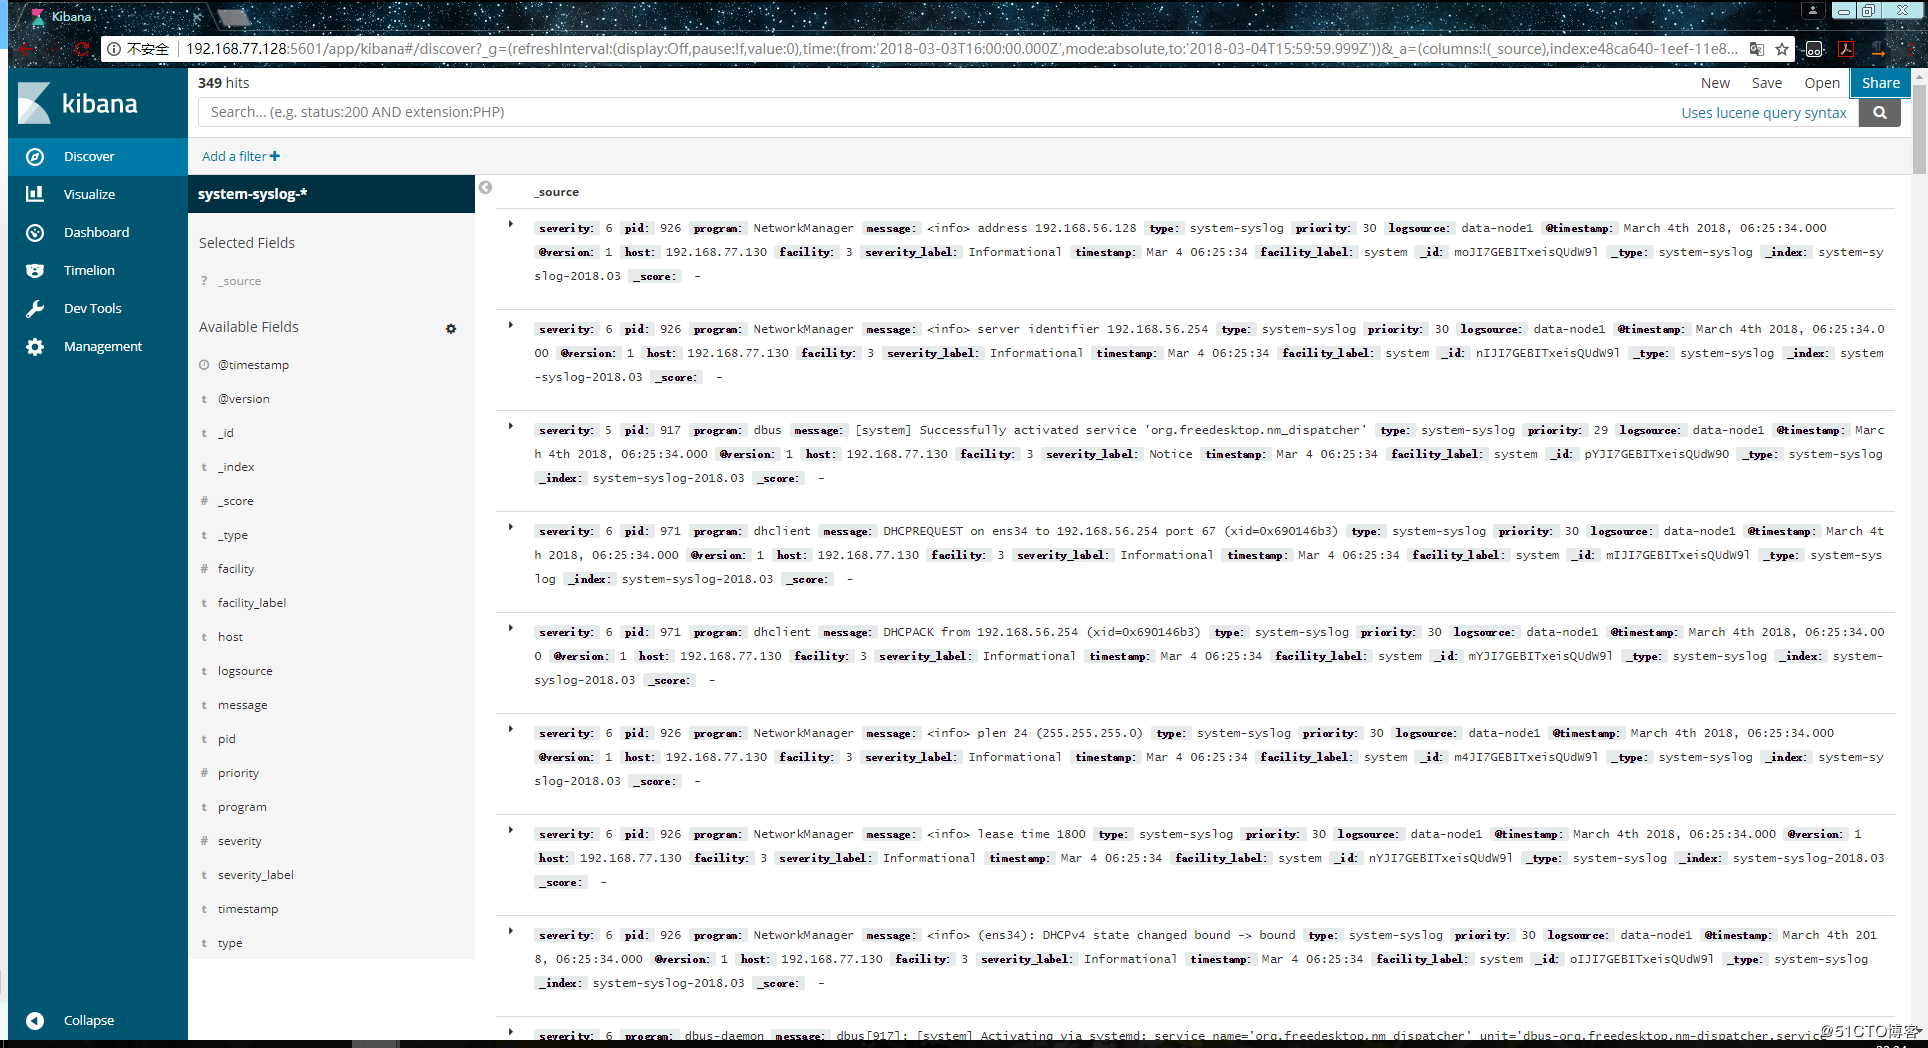
如果es服务器正常返回信息,但是 “Discover” 页面却依旧显示无法查找到日志信息的话,就使用另一种方式,进入设置删除掉索引:
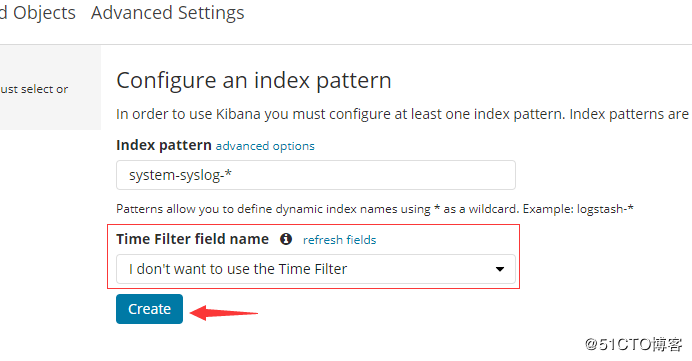
重新添加索引,但是这次不要选择 @timestampe 了:
但是这种方式只能看到数据,没有可视化的柱状图:
其实这里显示的日志数据就是 /var/log/messages 文件里的数据,因为logstash里配置的就是收集messages 文件里的数据。
以上这就是如何使用logstash收集系统日志,输出到es服务器上,并在kibana的页面上进行查看。
和收集syslog一样,首先需要编辑配置文件,这一步在logstash服务器上完成:
1
2
3
4
5
6
7
8
9
10
11
12
13
14
15
16
17
18
19
20
21
22
23
24
25
26
27
28
29
30
31
32
33
34
35
36
37
38
39
40
41
42
43
44
45
46
47
48
49
50
51
52
53
54
55
56
57
58
59
60
61
62
63
64
65
66
67
68
69
70
1. [root@data-node1 ~]# vim /etc/logstash/conf.d/nginx.conf # 增加如下内容 2. input { 3. file { # 指定一个文件作为输入源 4. path => "/tmp/elk_access.log" # 指定文件的路径 5. start_position => "beginning" # 指定何时开始收集 6. type => "nginx" # 定义日志类型,可自定义 7. } 8. } 9. filter { # 配置过滤器 10. grok { 11. match => { "message" => "%{IPORHOST:http_host} %{IPORHOST:clientip} - %{USERNAME:remote_user} \[%{HTTPDATE:timestamp}\] \"(?:%{WORD:http_verb} %{NOTSPACE:http_request}(?: HTTP/%{NUMBER:http_version})?|%{DATA:raw_http_request})\" %{NUMBER:response} (?:%{NUMBER:bytes_read}|-) %{QS:referrer} %{QS:agent} %{QS:xforwardedfor} %{NUMBER:request_time:float}"} # 定义日志的输出格式 12. } 13. geoip { 14. source => "clientip" 15. } 16. } 17. output { 18. stdout { codec => rubydebug } 19. elasticsearch { 20. hosts => ["192.168.77.128:9200"] 21. index => "nginx-test-%{+YYYY.MM.dd}" 22. } 23. }
同样的编辑完配置文件之后,还需要检测配置文件是否有错:
1
2
3
4
5
6
7
8
9
10
11
12
13
14
15
16
1. [root@data-node1 ~]# cd /usr/share/logstash/bin 2. [root@data-node1 /usr/share/logstash/bin]# ./logstash --path.settings /etc/logstash/ -f /etc/logstash/conf.d/nginx.conf --config.test_and_exit 3. Sending Logstash's logs to /var/log/logstash which is now configured via log4j2.properties 4. Configuration OK 5. [root@data-node1 /usr/share/logstash/bin]#
检查完毕之后,进入你的nginx虚拟主机配置文件所在的目录中,新建一个虚拟主机配置文件:
1
2
3
4
5
6
7
8
9
10
11
12
13
14
15
16
17
18
19
20
21
22
23
24
25
26
27
28
29
30
31
32
33
34
35
36
37
38
39
40
41
42
1. [root@data-node1 ~]# cd /usr/local/nginx/conf/vhost/ 2. [root@data-node1 /usr/local/nginx/conf/vhost]# vim elk.conf 3. server { 4. listen 80; 5. server_name elk.test.com; 6. 7. location / { 8. proxy_pass http://192.168.77.128:5601; 9. proxy_set_header Host $host; 10. proxy_set_header X-Real-IP $remote_addr; 11. proxy_set_header X-Forwarded-For $proxy_add_x_forwarded_for; 12. } 13. 14. access_log /tmp/elk_access.log main2; 15. }
配置nginx的主配置文件,因为需要配置日志格式,在 log_format combined_realip 那一行的下面增加以下内容:
1
2
3
4
5
6
7
8
9
10
11
12
13
1. [root@data-node1 ~]# vim /usr/local/nginx/conf/nginx.conf 2. log_format main2 '$http_host $remote_addr - $remote_user [$time_local] "$request" ' 3. '$status $body_bytes_sent "$http_referer" ' 4. '"$http_user_agent" "$upstream_addr" $request_time';
完成以上配置文件的编辑之后,检测配置文件有没有错误,没有的话就reload重新加载:
1
2
3
4
5
6
7
8
9
10
11
12
13
14
15
16
17
18
19
1. [root@data-node1 ~]# /usr/local/nginx/sbin/nginx -t 2. nginx: [warn] conflicting server name "aaa.com" on 0.0.0.0:80, ignored 3. nginx: the configuration file /usr/local/nginx/conf/nginx.conf syntax is ok 4. nginx: configuration file /usr/local/nginx/conf/nginx.conf test is successful 5. [root@data-node1 ~]# /usr/local/nginx/sbin/nginx -s reload 6. [root@data-node1 ~]#
由于我们需要在windows下通过浏览器访问我们配置的 elk.test.com 这个域名,所以需要在windows下编辑它的hosts文件增加以下内容:
1 192.168.77.130 elk.test.com
这时在浏览器上就可以通过这个域名进行访问了:
访问成功后,查看生成的日志文件:
1
2
3
4
5
6
7
8
9
10
11
12
13
14
15
16
17
18
19
1. [root@data-node1 ~]# ls /tmp/elk_access.log 2. /tmp/elk_access.log 3. [root@data-node1 ~]# wc -l !$ 4. wc -l /tmp/elk_access.log 5. 45 /tmp/elk_access.log 6. [root@data-node1 ~]#
如上,可以看到,nginx的访问日志已经生成了。
重启logstash服务,生成日志的索引:
systemctl restart logstash
重启完成后,在es服务器上检查是否有nginx-test开头的索引生成:
1
2
3
4
5
6
7
8
9
10
11
12
13
14
15
16
17
18
19
1. [root@master-node ~]# curl '192.168.77.128:9200/_cat/indices?v' 2. health status index uuid pri rep docs.count docs.deleted store.size pri.store.size 3. green open .kibana 6JfXc0gFSPOWq9gJI1ZX2g 1 1 2 0 14.4kb 7.2kb 4. green open system-syslog-2018.03 bUXmEDskTh6fjGD3JgyHcA 5 1 902 0 1.1mb 608.9kb 5. green open nginx-test-2018.03.04 GdKYa6gBRke7mNgrh2PBUA 5 1 45 0 199kb 99.5kb 6. [root@master-node ~]#
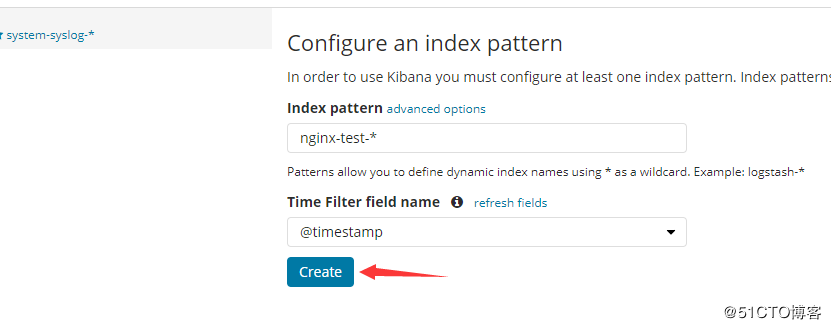
可以看到,nginx-test索引已经生成了,那么这时就可以到kibana上配置该索引:
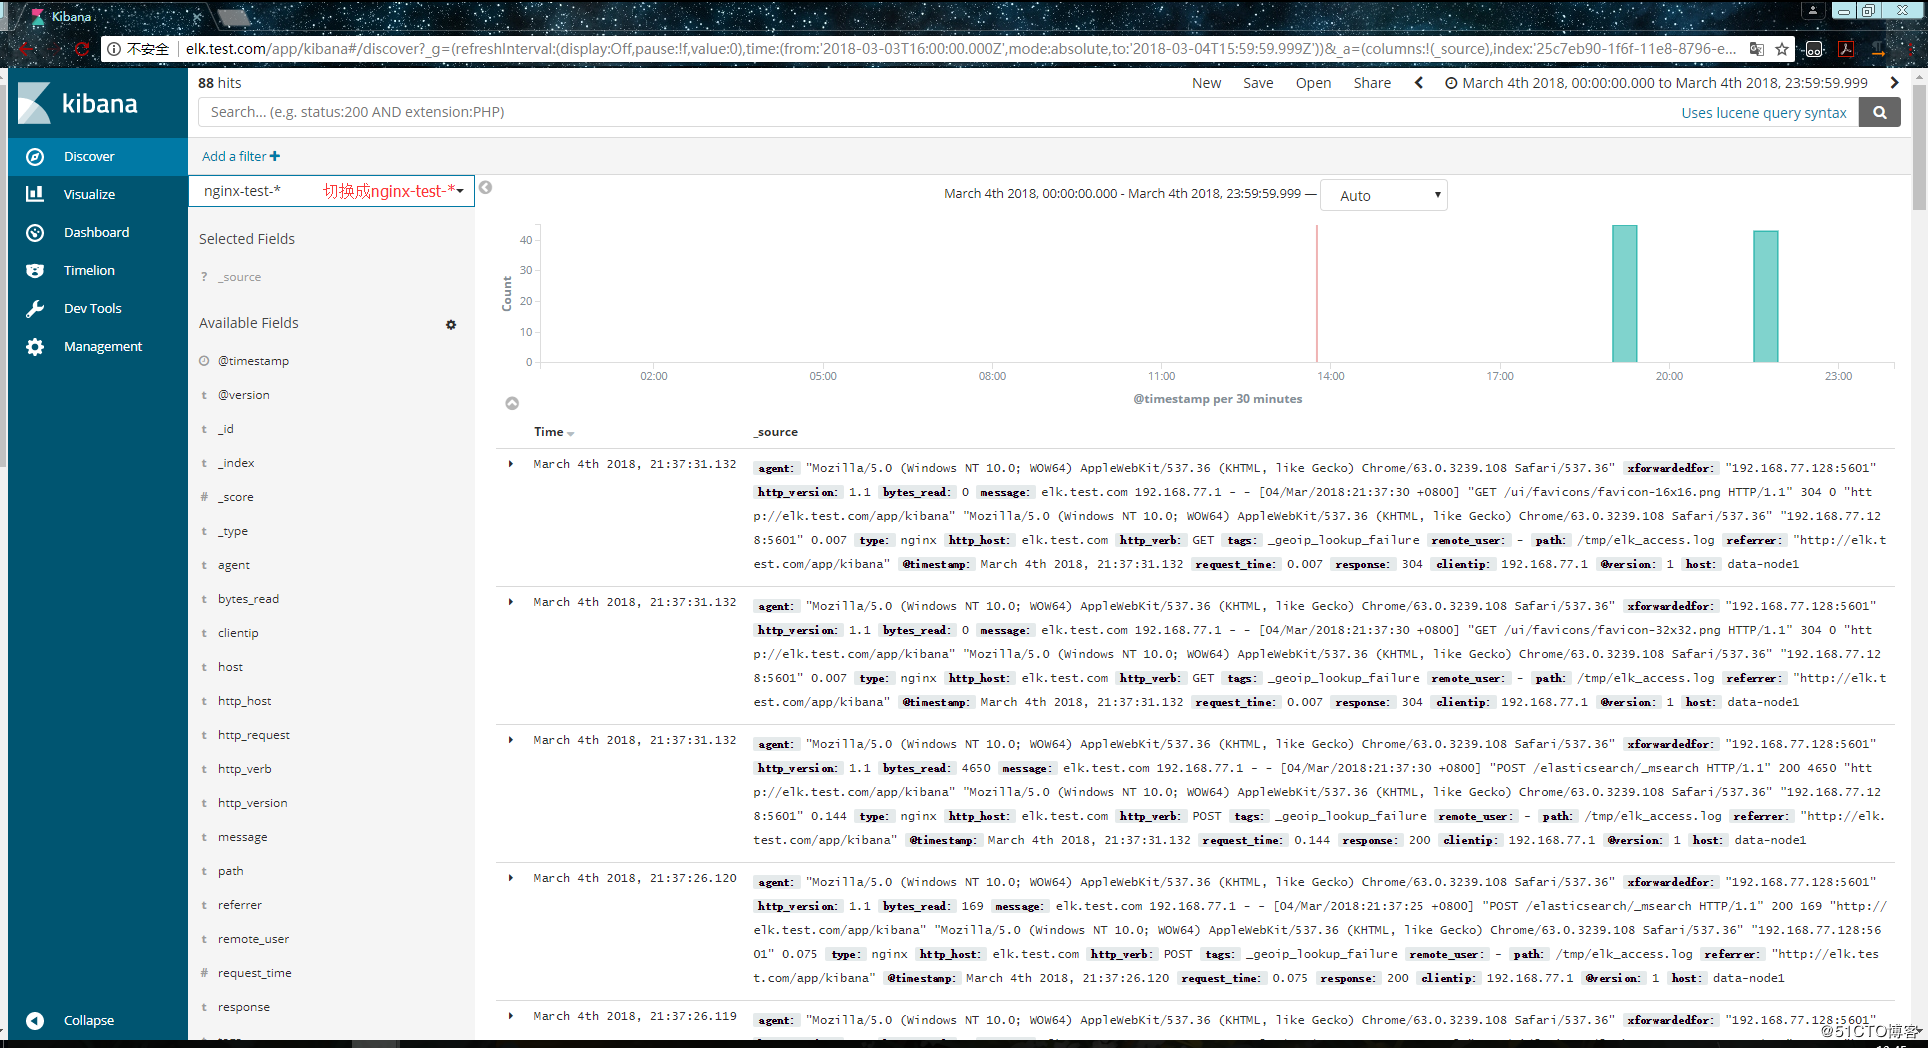
配置完成之后就可以在 “Discover” 里进行查看nginx的访问日志数据了:
之前也介绍过beats是ELK体系中新增的一个工具,它属于一个轻量的日志采集器,以上我们使用的日志采集工具是logstash,但是logstash占用的资源比较大,没有beats轻量,所以官方也推荐使用beats来作为日志采集工具。而且beats可扩展,支持自定义构建。
官方介绍:
https://www.elastic.co/cn/products/beats
在 192.168.77.134 上安装filebeat,filebeat是beats体系中用于收集日志信息的工具:
1
2
3
4
5
6
7
1. [root@data-node2 ~]# wget https://artifacts.elastic.co/downloads/beats/filebeat/filebeat-6.0.0-x86_64.rpm 2. [root@data-node2 ~]# rpm -ivh filebeat-6.0.0-x86_64.rpm
安装完成之后编辑配置文件:
1
2
3
4
5
6
7
8
9
10
11
12
13
14
15
16
17
18
19
20
21
22
23
24
25
26
27
28
29
30
31
32
33
34
35
36
1. [root@data-node2 ~]# vim /etc/filebeat/filebeat.yml # 增加或者更改为以下内容 2. filebeat.prospectors: 3. - type: log 4. #enabled: false 这一句要注释掉 5. paths: 6. - /var/log/messages # 指定需要收集的日志文件的路径 7. 8. #output.elasticsearch: # 先将这几句注释掉 9. # Array of hosts to connect to. 10. # hosts: ["localhost:9200"] 11. 12. output.console: # 指定在终端上输出日志信息 13. enable: true
配置完成之后,执行以下命令,看看是否有在终端中打印日志数据,有打印则代表filebeat能够正常收集日志数据:
1 [root@data-node2 ~]# /usr/share/filebeat/bin/filebeat -c /etc/filebeat/filebeat.yml
以上的配置只是为了测试filebeat能否正常收集日志数据,接下来我们需要再次修改配置文件,将filebeat作为一个服务启动:
1
2
3
4
5
6
7
8
9
10
11
12
13
14
15
16
17
18
19
20
21
22
23
1. [root@data-node2 ~]# vim /etc/filebeat/filebeat.yml 2. #output.console: 把这两句注释掉 3. # enable: true 4. 5. # 把这两句的注释去掉 6. output.elasticsearch: 7. # Array of hosts to connect to. 8. hosts: ["192.168.77.128:9200"] # 并配置es服务器的ip地址
修改完成后就可以启动filebeat服务了:
1
2
3
4
5
6
7
8
9
10
11
12
13
1. [root@data-node2 ~]# systemctl start filebeat 2. [root@data-node2 ~]# ps axu |grep filebeat 3. root 3021 0.3 2.3 296360 11288 ? Ssl 22:27 0:00 /usr/share/filebeat/bin/filebeat -c /etc/filebeat/filebeat.yml -path.home /usr/share/filebeat -path.config /etc/filebeat -path.data /var/lib/filebeat -path.logs /var/log/filebeat 4. root 3030 0.0 0.1 112660 960 pts/0 S+ 22:27 0:00 grep --color=auto filebeat
启动成功后,到es服务器上查看索引,可以看到新增了一个以filebeat-6.0.0开头的索引,这就代表filesbeat和es能够正常通信了:
1
2
3
4
5
6
7
8
9
10
11
12
13
14
15
16
17
18
19
20
21
22
1. [root@master-node ~]# curl '192.168.77.128:9200/_cat/indices?v' 2. health status index uuid pri rep docs.count docs.deleted store.size pri.store.size 3. green open system-syslog-2018.03 bUXmEDskTh6fjGD3JgyHcA 5 1 73076 0 24.8mb 11.6mb 4. green open nginx-test-2018.03.04 GdKYa6gBRke7mNgrh2PBUA 5 1 91 0 1mb 544.8kb 5. green open .kibana 6JfXc0gFSPOWq9gJI1ZX2g 1 1 3 0 26.9kb 13.4kb 6. green open filebeat-6.0.0-2018.03.04 MqQJMUNHS_OiVmO26NEWTw 3 1 66 0 64.5kb 39.1kb 7. [root@master-node ~]#
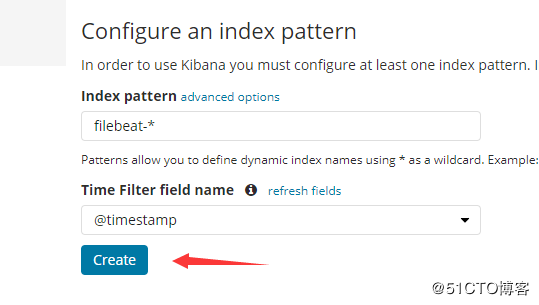
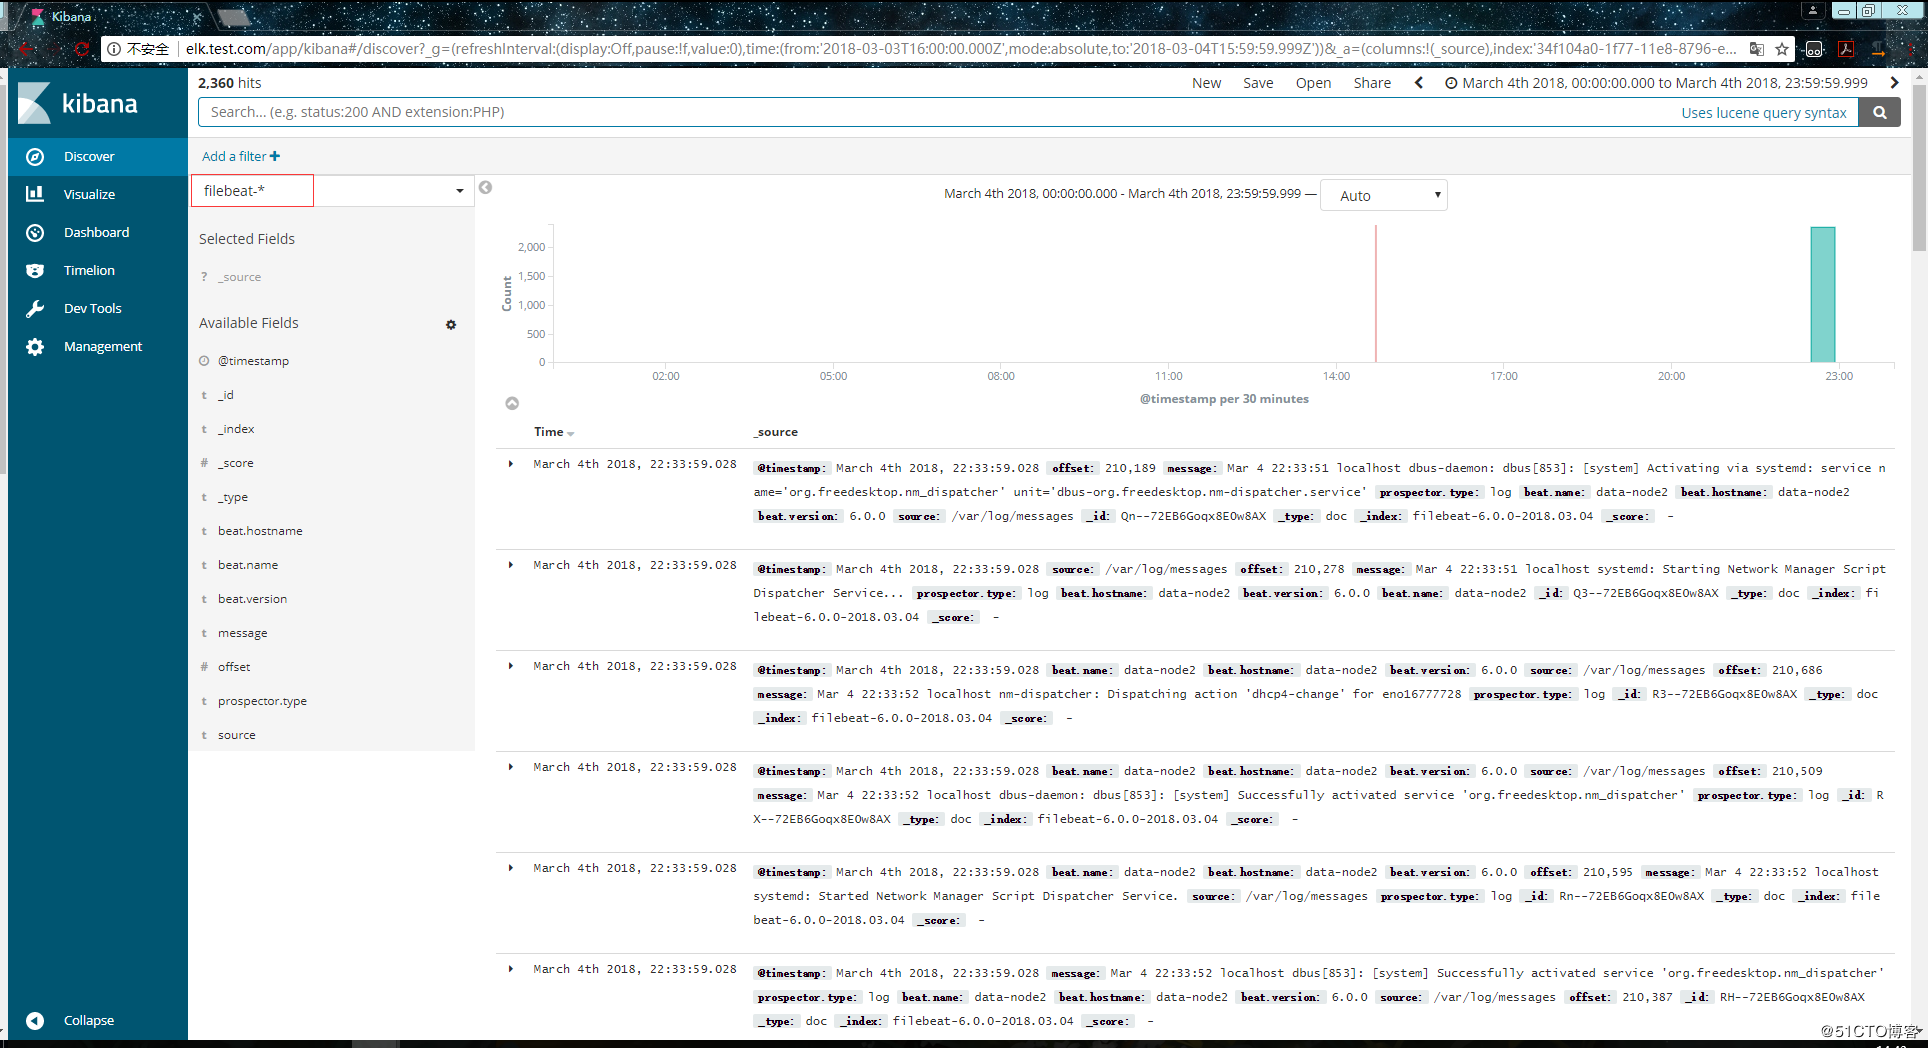
es服务器能够正常获取到索引后,就可以到kibana上配置这个索引了:
以上这就是如何使用filebeat进行日志的数据收集,可以看到配置起来比logstash要简单,而且占用资源还少。